Cancers for 3,693,799 Screening Mammography Examinations from 2011-2021
Note: Unless otherwise indicated, data are presented as numbers of cancers, with percentages in parentheses. AJCC = American Joint Committee on Cancer, DBT = digital breast tomosynthesis, DCIS = ductal carcinoma in situ, DM = digital mammography.
* Data are medians, and data in parentheses are IQRs.
† Prognostic pathologic stage greater than or equal to II, if missing then anatomic stage IIb or higher.
‡ If stage is between 2 categories (e.g. IB/IIA, IIB/IIIA) then set to missing.
Table and figure numbers last updated April 22, 2026.
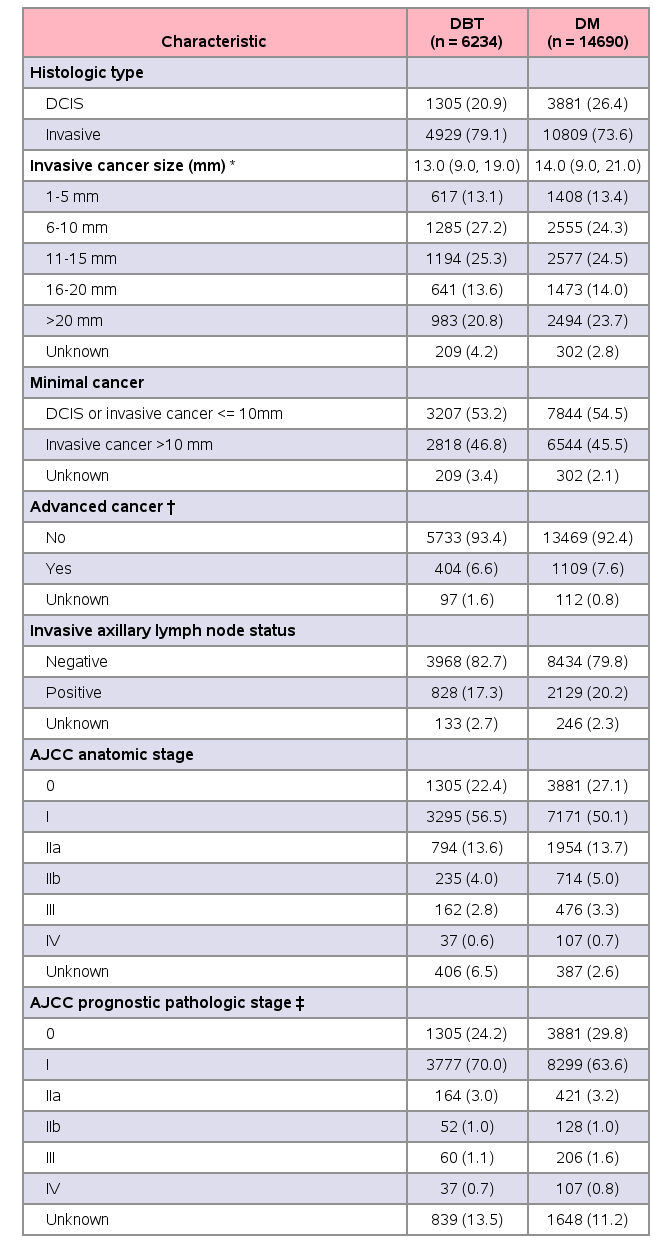
Cancer characteristics: Radiologist digital breast tomosynthesis (DBT) screening performance measures and acceptable ranges, 2011-2021
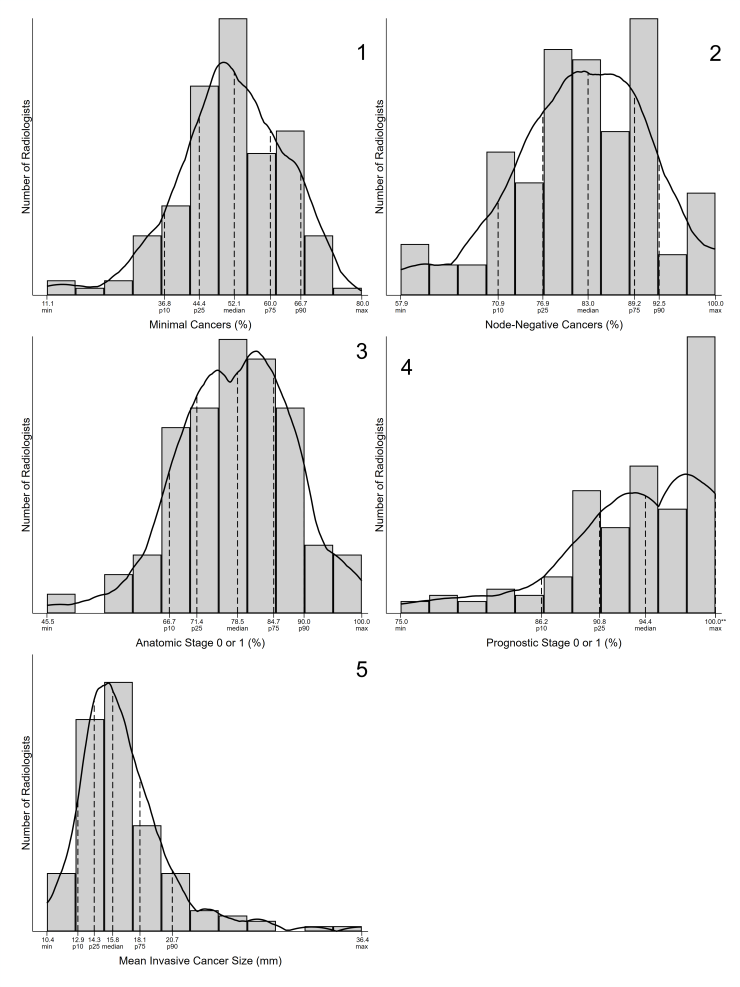
Histograms show the distribution of DBT screening performance benchmarks by radiologists including (1) Minimal Cancers (%), (2) Node-Negative Cancers (%), (3) Anatomic stage 0 or 1 (%), (4) Prognostic stage 0 or 1 (%), and (5) Mean Invasive Cancer Size (mm). Lightly shaded region indicates radiologists within acceptable ranges established previously by expert opinion (if applicable). Only radiologists with at least 1000 DBT screening interpretations during the study period were included (n = 165). The percentage of minimal cancers and the percentage of node-negative cancers were restricted to radiologists with at least 10 DBT screening-detected cancers (n = 140). BI-RADS = Breast Imaging Reporting and Data System, Max = maximum, min = minimum, p25 = 25th percentile, p75 = 75th percentile. *For prognostic stage, p75=p90=maximum; only maximum is labelled due to space constraints
Cancer characteristics: Radiologist digital mammography screening performance and acceptable ranges, 2011-2021
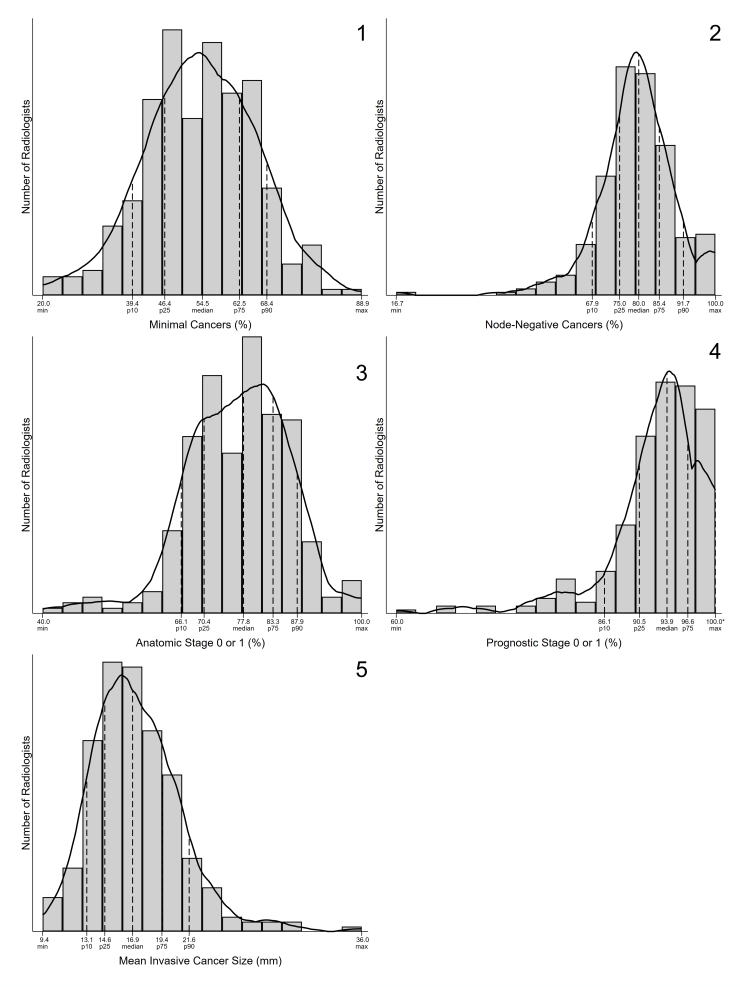
Histograms show the distribution of digital mammography screening performance benchmarks by radiologists including (1) Minimal Cancers (%), (2) Node-Negative Cancers (%), (3) Anatomic stage 0 or 1 (%), (4) Prognostic stage 0 or 1 (%), and (5) Mean Invasive Cancer Size (mm). Lightly shaded region indicates radiologists within acceptable ranges (if applicable). Only radiologists with ≥ 1000 digital mammography screening interpretations during the study period were included (n = 309). % minimal cancers and % node negative cancers restricted to radiologists with ≥ 10 digital mammography screen-detected cancers during the study period (n = 275). Max = maximum, min = minimum, p25 = 25th percentile, p75 = 75th percentile. *For prognostic stage, p90=maximum; only maximum is labelled due to space constraints
The following must be cited when reproducing this data:
"The Breast Cancer Surveillance Consortium and its data collection and sharing activities are funded by grants from the National Cancer Institute (P01CA154292, U54CA163303), Patient-Centered Outcomes Research Institute (PCS-1504-30370), and Agency for Health Research and Quality (R01 HS018366-01A1). Downloaded xx/xx/xxxx from the Breast Cancer Surveillance Consortium Web site - http://www.bcsc-research.org/. More information regarding the BCSC is available at: http://bcsc-research.org/."