Mammograms by Race/Ethnicity, 1996-2023
| Race/Ethnicity | Percentage of Mammograms | Percentage of US Women |
|---|---|---|
| American Indian or Alaska Native | 0.3% | 0.6% |
| Asian or Pacific Islander | 9.5% | 6.5% |
| Black | 10.4% | 12.2% |
| Hispanic | 5.2% | 16.5% |
| White | 72.8% | 60.3% |
| Other or Multiple (2+ races) | 1.7% | 3.9% |
This table shows the racial/ethnic distribution of 13,719,808 mammograms recorded in 1996-2023 from 8 BCSC sites. The BCSC’s standardized questions for race and ethnicity were asked in a similar manner as on the US census from 2000-2020.
The racial/ethnic distribution among 133.0 million US women age 18+ years in 2020 is shown for comparison.*
Note: All categories are non-Hispanic except the Hispanic category.
Note: The numbers in the table at the left exclude N=764,303 mammograms with missing race. Missingness is due primarily to women choosing not to self-report race and certain facilities not collecting race information.
*U.S. Census Bureau. 2023. 2020 Census Demographic and Housing Characteristics File (DHC), Tables P12H–P12O. Retrieved from data.census.gov.
Number of Screening Mammograms per Woman, 1996-2023
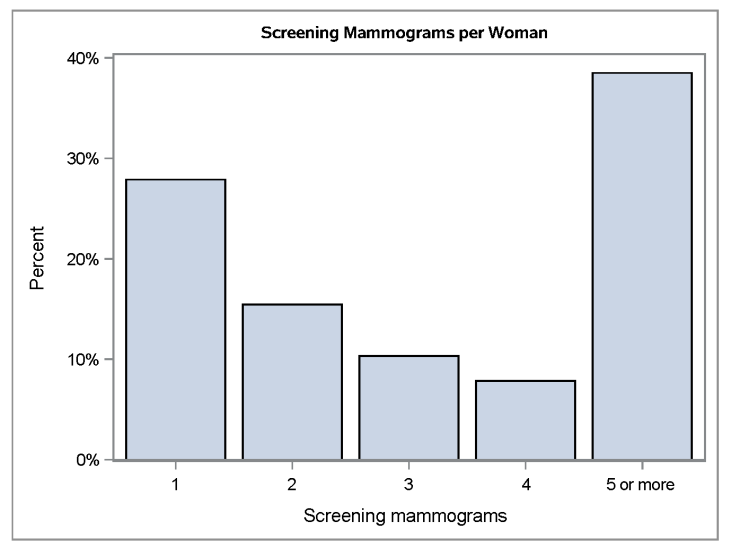
One strength of the BCSC is the ability to follow women longitudinally. This figure shows the number of screening mammograms per woman in 8 BCSC sites in 1996-2023. While approximately 28% of the women have only one screening mammogram in BCSC data, it should not be interpreted that these women had only one mammogram in twenty-eight years. The women may have had screening mammograms at facilities that were not in the BCSC. For women with multiple exams in the BCSC, we can examine patterns and screening performance over time.
Volume of Film, Digital, and 3D Mammograms in the BCSC by Year, 1996-2023
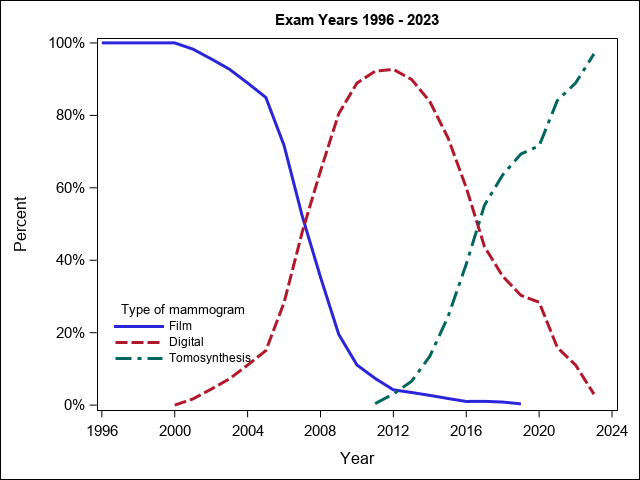
The BCSC data reflect the large changes over time in the types of mammograms used in U.S. community practice. Until the early 2000s almost all mammograms were film, then digital mammograms became common, followed in recent years by the growth in 3D mammography (also known as tomosynthesis). Film mammography has all but disappeared.
Note: These graphs support special accessibility features in the Google Chrome browser. To use these features, please download the required Chrome browser extension here.
Note: These graphs support special accessibility features in the Google Chrome browser. To use these features, please download the required Chrome browser extension here.
Number of Film, Digital, and 3d Mammograms in the bcsc by year, 1996-2023
Associated with figure above.
| Year | Film | Digital | Tomosynthesis | Mammogram, NOS |
Total |
|
1996 |
201,158 |
. |
. |
5 |
201,163 |
|
1997 |
324,956 |
. |
. |
56 |
325,012 |
|
1998 |
421,278 |
. |
. |
151 |
421,429 |
|
1999 |
448,495 |
. |
. |
194 |
448,689 |
|
2000 |
476,638 |
6 |
. |
79 |
476,723 |
|
2001 |
476,145 |
8,315 |
. |
7,851 |
492,311 |
|
2002 |
544,069 |
25,119 |
. |
4,109 |
573,297 |
|
2003 |
525,178 |
41,042 |
. |
3,539 |
569,759 |
|
2004 |
512,161 |
63,697 |
. |
14,105 |
589,963 |
|
2005 |
512,989 |
90,907 |
. |
42,985 |
646,881 |
|
2006 |
449,500 |
177,418 |
. |
31,948 |
658,866 |
|
2007 |
340,956 |
312,692 |
. |
9,918 |
663,566 |
|
2008 |
245,865 |
449,905 |
. |
2,130 |
697,900 |
|
2009 |
137,779 |
567,161 |
. |
2,390 |
707,330 |
|
2010 |
75,677 |
606,691 |
. |
1,643 |
684,011 |
|
2011 |
45,668 |
570,975 |
2,640 |
526 |
619,809 |
|
2012 |
26,093 |
572,798 |
19,033 |
344 |
618,268 |
|
2013 |
22,106 |
569,091 |
41,733 |
4,189 |
637,119 |
|
2014 |
16,231 |
505,231 |
81,340 |
3,238 |
606,040 |
|
2015 |
10,206 |
412,025 |
136,418 |
15,117 |
573,766 |
|
2016 |
5,222 |
308,839 |
200,398 |
22,550 |
537,009 |
|
2017 |
5,097 |
212,059 |
267,557 |
787 |
485,500 |
|
2018 |
4,548 |
190,470 |
340,345 |
785 |
536,148 |
|
2019 |
2,004 |
171,071 |
391,331 |
778 |
565,184 |
|
2020 |
. |
81,726 |
205,998 |
749 |
288,473 |
|
2021 |
. |
61,243 |
324,247 |
1,005 |
386,495 |
|
2022 |
. |
41,934 |
336,970 |
1,012 |
379,916 |
|
2023 |
. |
2,895 |
90,540 |
49 |
93,484 |
|
Total |
5,830,019 |
6,043,310 |
2,438,550 |
172,232 |
14,484,111 |
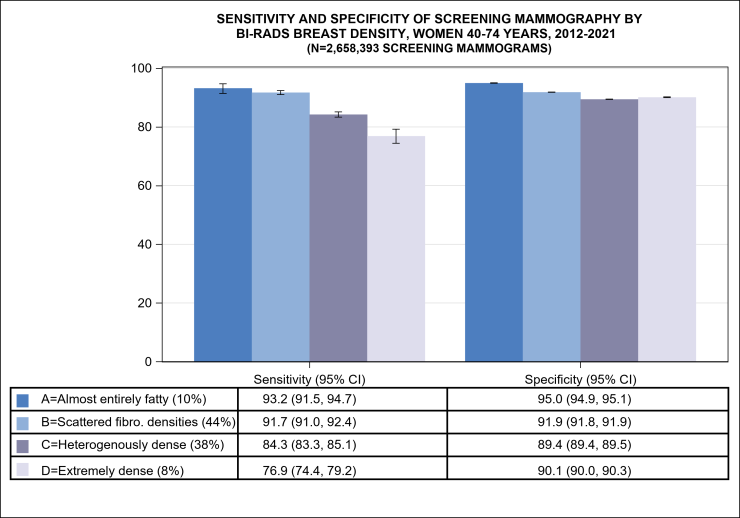
Sensitivity and Specificity of Screening Digital Mammography by BI-RADS Density, Women 40-74 years, 2012-2021
N = 2,658,393 screening exams
The following must be cited when reproducing this data:
"The Breast Cancer Surveillance Consortium and its data collection and sharing activities are funded by the National Cancer Institute (P01CA154292). Downloaded xx/xx/xxxx from the Breast Cancer Surveillance Consortium Web site - http://www.bcsc-research.org/. More information regarding the BCSC is available at: http://bcsc-research.org/."