Performance measures for 2,301,766 Screening Mammography Examinations from 2011 - 2018

Note: Data in parentheses are 95% CIs based on generalized estimated equations with a working independence correlation structure to account for clustering within women, radiologists, and facilities.
CDR = cancer detection rate, DBT = digital breast tomosynthesis, DM = digital mammography, FN = false negative, FNR = false-negative rate, PPV = positive predictive value, TN = true negative, TP = true positive.
Table and figure numbers last updated September 6, 2023.
Radiologist digital breast tomosynthesis (DBT) screening performance and acceptable ranges, 2011-2018
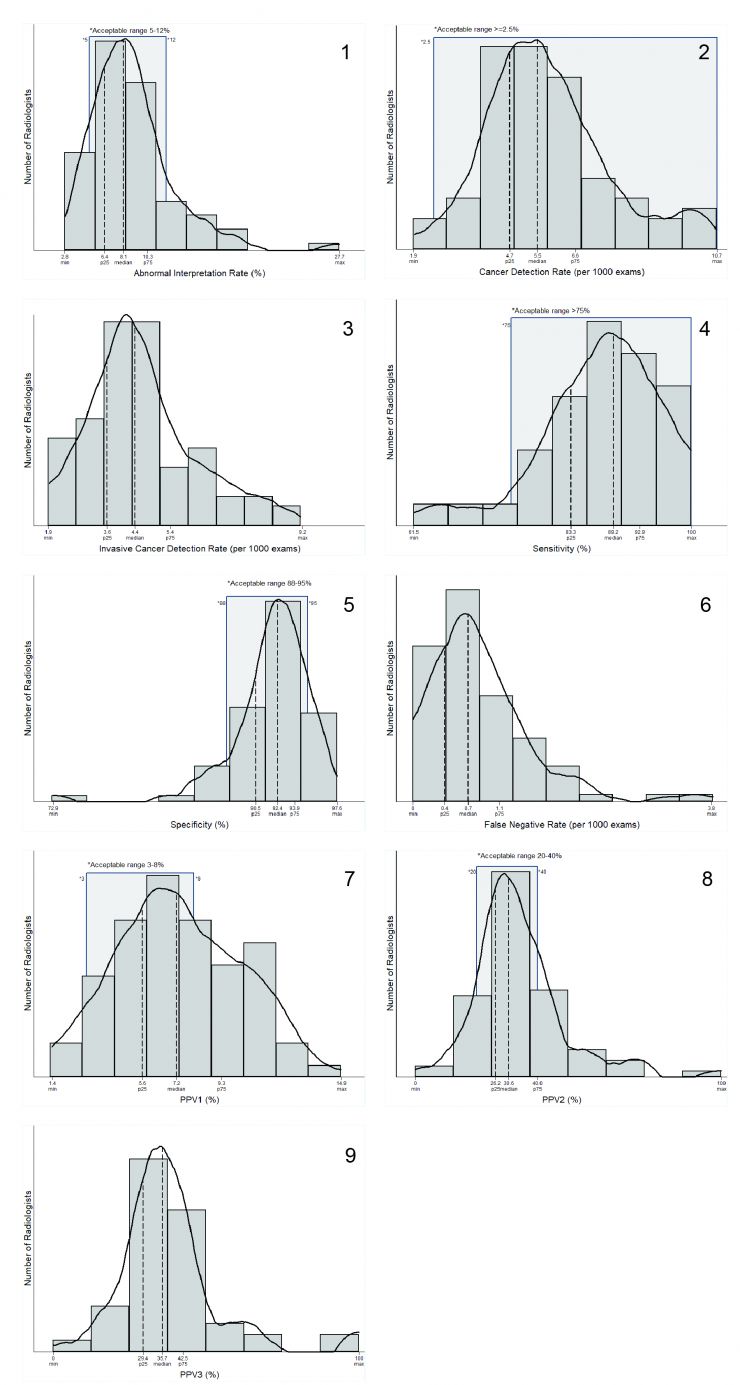
Histograms show the distribution of DBT screening performance benchmarks by radiologists including (1) Abnormal Interpretation Rate (AIR) (%), (2) Cancer Detection Rate (CDR) (per 1000 examinations), (3) Invasive CDR (per 1000 examinations), (4) Sensitivity (%), (5) Specificity (%), (6) False Negative Rate (per 1000 examinations), (7) PPV1, (8) PPV2, and (9) PPV3. Lightly shaded region indicates radiologists within acceptable ranges established previously by expert opinion (if applicable). With DBT, 97.6%, 91.8%, 75.0%, and 74.0% of radiologists achieved the recommended acceptable performance ranges for CDR, sensitivity, AIR, and specificity, respectively. Only radiologists with at least 1000 DBT screening interpretations during the study period were included (n = 84). Sensitivity and specificity were restricted to radiologists with at least 10 DBT screening-detected cancers (n = 73). With DBT, 53.6% and 63.5% of radiologists assessed achieved the recommended acceptable performance ranges for PPV1 and PPV2, respectively. Max = maximum, min = minimum, p25 = 25th percentile, p75 = 75th percentile. PPV1 = examinations with abnormal interpretation (BI-RADS 0, 3, 4, or 5), PPV2 = recommendation for tissue diagnosis (BI-RADS 4 or 5), PPV3 = PPV of biopsy performed.
Radiologist digital MAMMOGRAPHY (DM) screening performance and acceptable ranges, 2011-2018
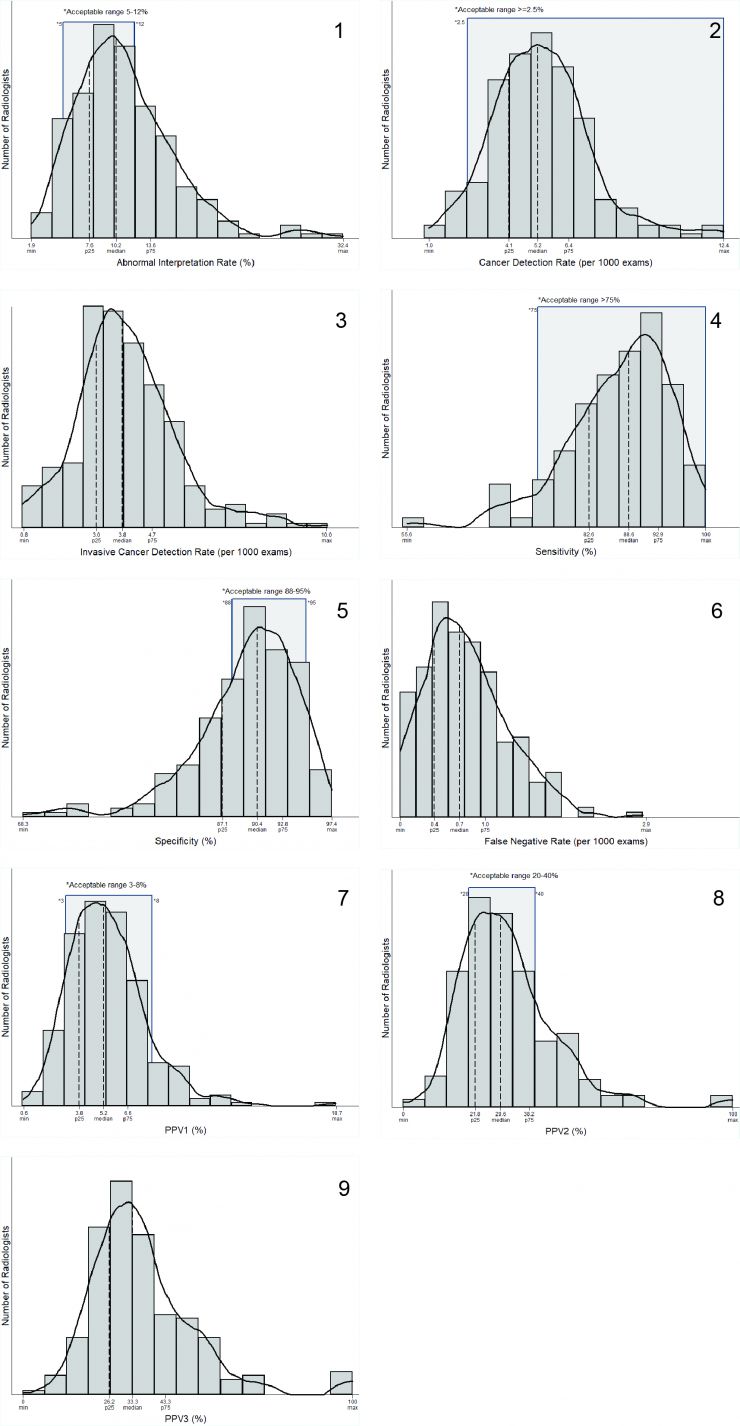
Histograms show the distribution of digital mammography screening performance benchmarks by radiologists including (1) Abnormal Interpretation Rate (%), (2) Cancer Detection Rate (per 1000 examinations), (3) Invasive CDR (per 1000 examinations), (4) Sensitivity (%), (5) Specificity (%), (6) False Negative Rate (per 1000 examinations), (7) PPV1, (8) PPV2, and (9) PPV3. Lightly shaded region indicates radiologists within acceptable ranges (if applicable). Only radiologists with ≥ 1000 digital mammography screening interpretations during the study period were included (n = 249). Sensitivity and specificity restricted to radiologists with ≥ 10 digital mammography screen-detected cancers during the study period (n = 222). Max = maximum, min = minimum, p25 = 25th percentile, p75 = 75th percentile. PPV1 = examinations with abnormal interpretation (BI-RADS 0, 3, 4, or 5), PPV2 = recommendation for tissue diagnosis (BI-RADS 4 or 5), PPV3 = PPV of biopsy performed.
The following must be cited when reproducing this data:
"The Breast Cancer Surveillance Consortium and its data collection and sharing activities are funded by the National Cancer Institute (P01CA154292). Downloaded xx/xx/xxxx from the Breast Cancer Surveillance Consortium Web site - http://www.bcsc-research.org/."